SIP vs. Buying the Dip: What 20 Years of Market Data Tells Us
August 30, 2026
Every time the stock market stumbles, a familiar debate resurfaces. One camp advocates for automated discipline: set a monthly Systematic Investment Plan (SIP) and ignore daily fluctuations. The other camp argues for tactical patience: park cash in a liquid fund, wait for red days, and “buy the dip” to acquire cheaper units.
On paper, waiting for a dip sounds like an obvious upgrade. Why buy at market peaks when you can wait for a discount? Many retail investors spend hours watching index alerts, debating whether a 1% or 2% fall is deep enough to pull the trigger.
To evaluate whether this effort actually pays off, we examined 20+ years of historical Indian market data (2005 to 2026) across 233 rolling 12-month cohorts. We tested an annual capital of ₹1,20,000 deployed through two methods: a fixed monthly SIP of ₹10,000 versus a “Buy the Dip” strategy where ₹10,000 pools monthly in a liquid fund (taxed at 30% STCG) and deploys accumulated cash whenever the market falls by a specific threshold (1%, 2%, 3%, or 5% from its recent 30-day peak).
The empirical data reveals an eye-opening reality: while buying small dips in large caps technically wins slightly more often, the actual monetary difference is virtually negligible. Meanwhile, in faster-moving assets like midcaps and gold, waiting for dips actively harms returns.
The Concept: Mechanical Automation vs. Tactical Timing
To compare both strategies fairly, we must look at how each handles deployment in practice:
- Regular Monthly SIP: On a fixed date each month, ₹10,000 is automatically debited and invested into the target fund regardless of market levels. You achieve complete automation and zero decision fatigue.
- Buy the Dip (Pooled Deployment): Every month, ₹10,000 is deposited into a liquid fund pool earning ~6% p.a. Crucially, you do not need 12 separate dips to deploy ₹1.2 Lakh. Whenever a dip triggers relative to the 30-day peak, 100% of whatever cash has accumulated in the liquid pool is deployed at once into the market (net of 30% STCG tax). For example, if only 3 dips occur throughout the entire year, each dip deploys roughly ₹40,000 of accumulated cash.
What Happens if Dips Stop Occurring?
A practical question arises: what happens if the market enters a relentless bull run and few or no dips occur toward the end of the year?
In our backtest, uninvested money remained in the liquid fund until Month 12 (the evaluation date). At Month 12, any leftover cash was converted into equivalent target units at the final Month 12 closing price ():
This design reflects real-world investing dynamics. In strong bull markets, holding money in a liquid fund while waiting for dips that never arrive forces you to buy units at much higher closing prices at year-end. This cash drag explains why Regular SIP beat Buy the Dip in about 55% of Nifty 50 bull market cohorts.
At Month 12, both strategies complete their deployment. Because no further transactions happen after Month 12, the units accumulated at the end of the year determine your portfolio trajectory for the rest of your holding period.
The Empirical Findings: A Tiny Edge at High Effort
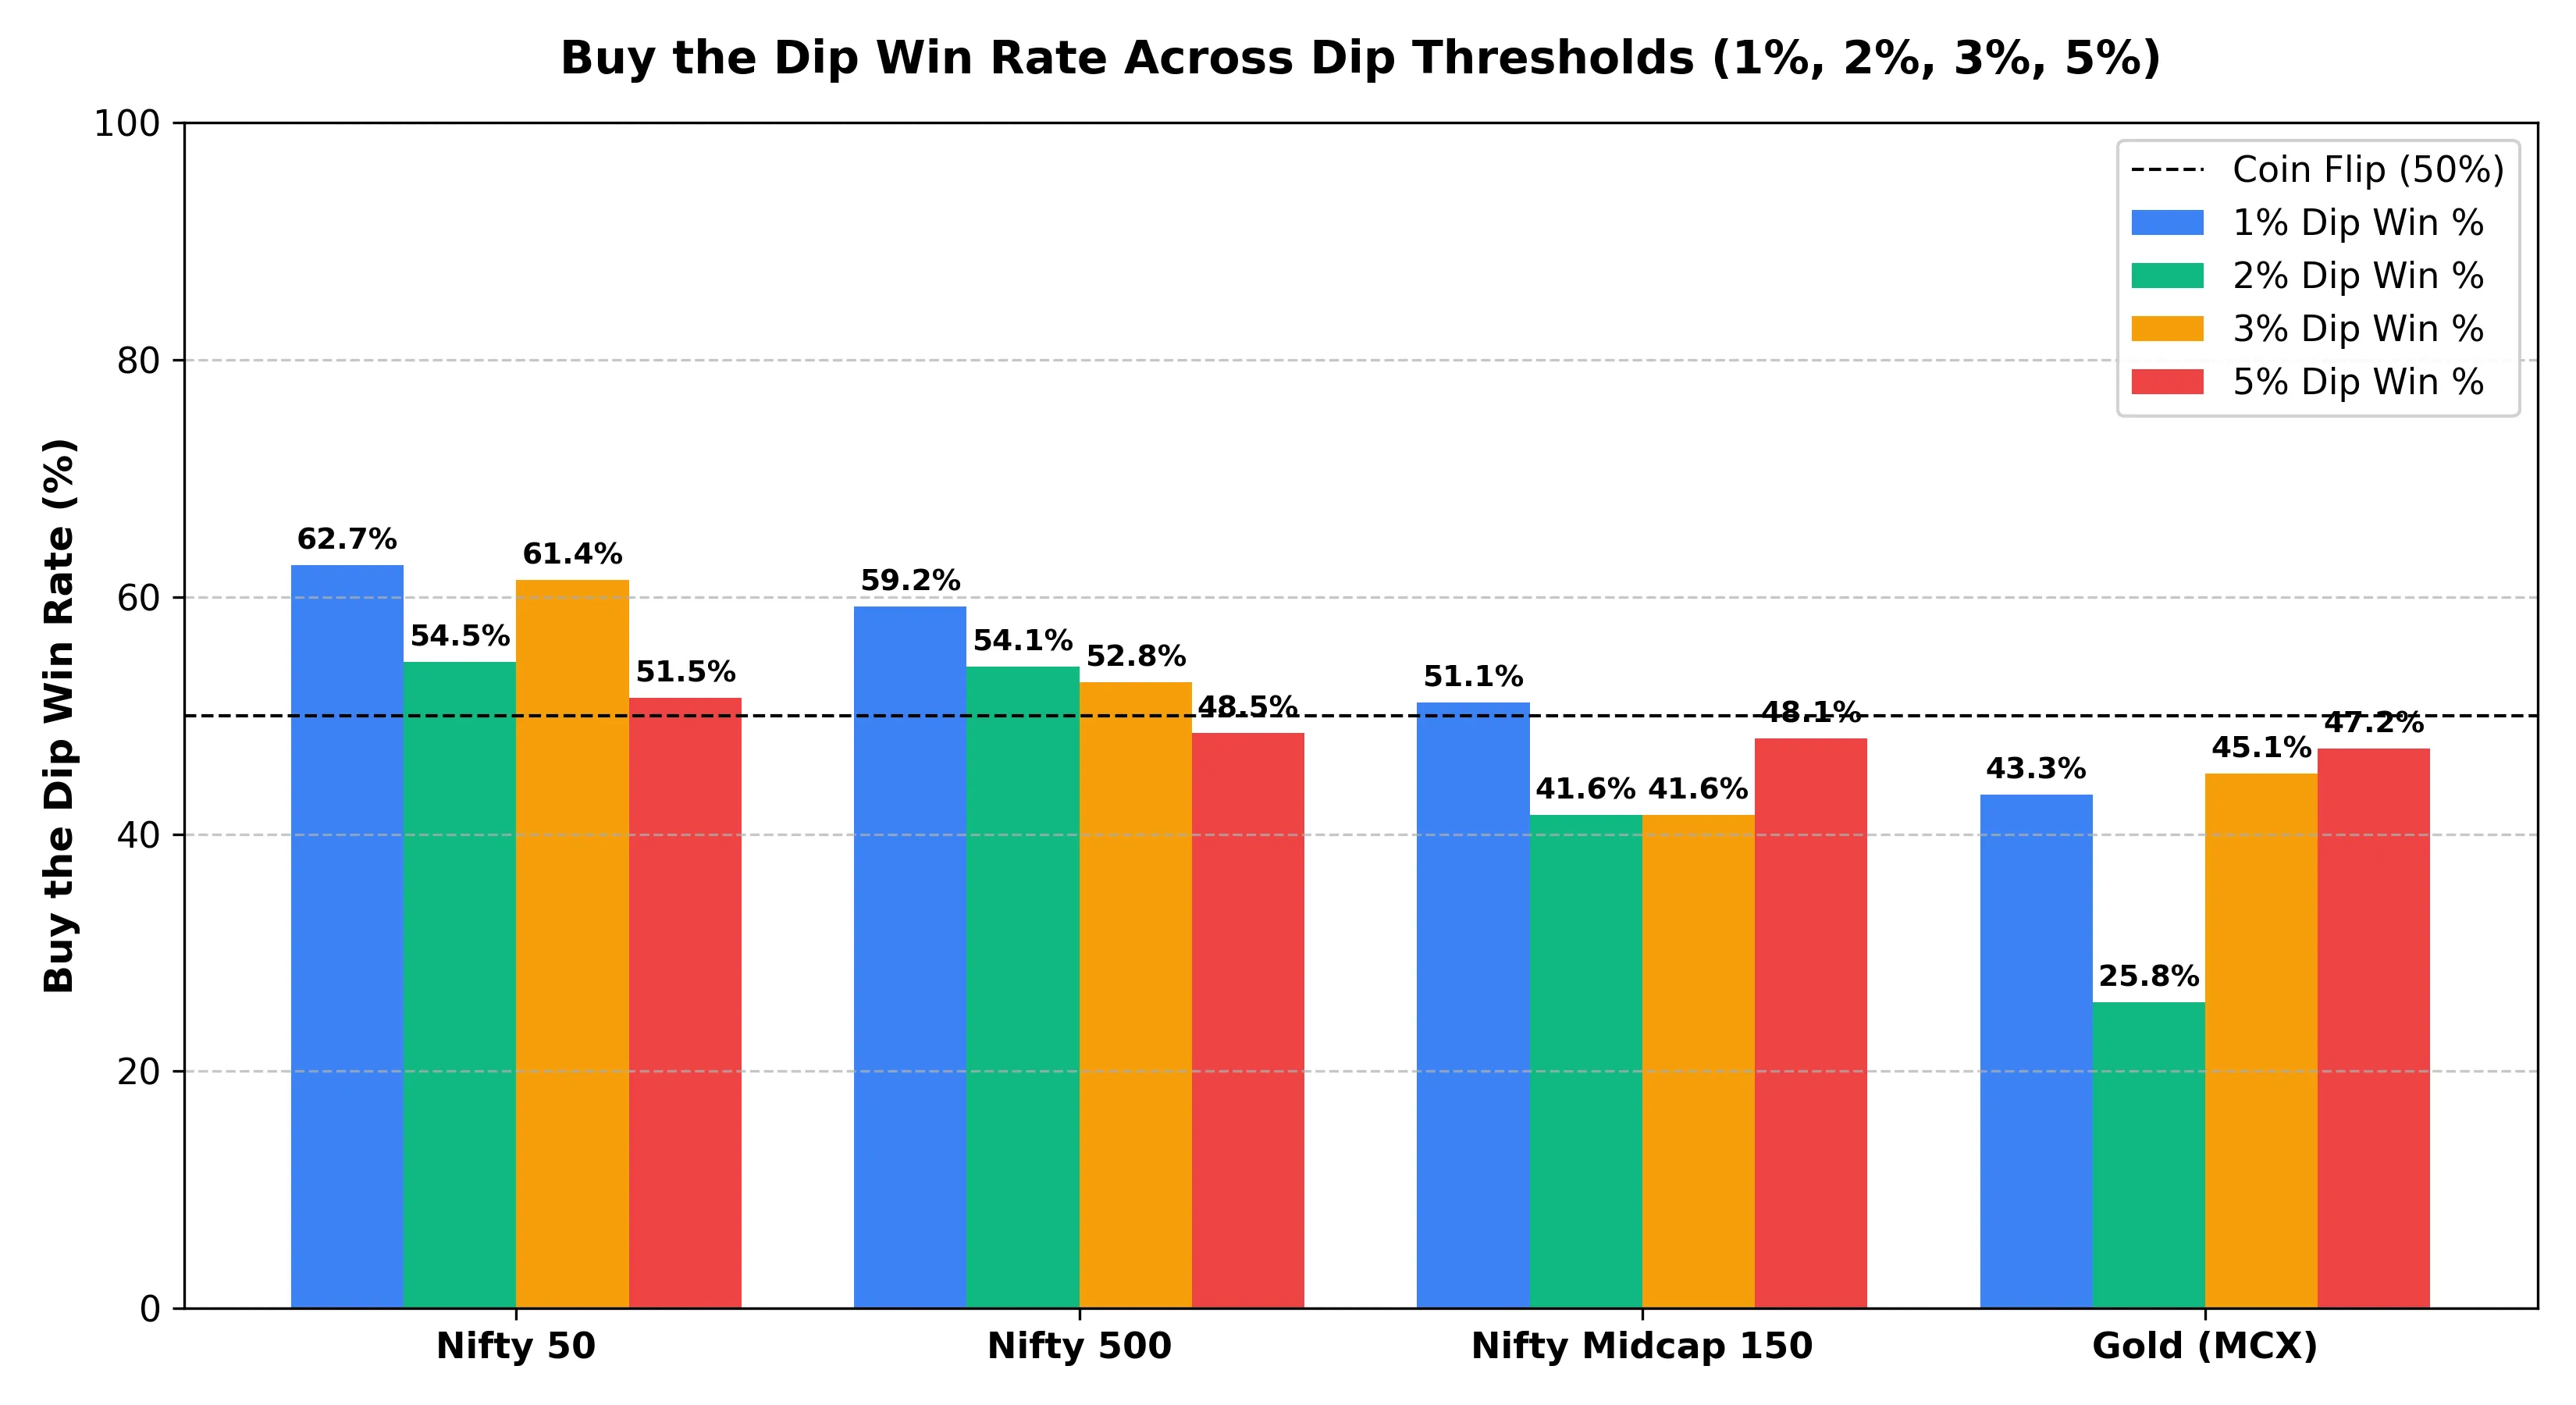
Across 233 rolling cohorts spanning bull, bear, and sideways cycles, the backtest shows distinct patterns across asset classes:
| Asset Class | Strategy / Threshold | Regular SIP Win Rate | Buy the Dip Win Rate | Avg. SIP Value (₹) | Avg. Dip Value (₹) | Median Difference (₹) |
|---|---|---|---|---|---|---|
| Nifty 50 | 1% Dip | 37.3% | 62.7% | ₹1,27,489 | ₹1,27,558 | -₹187 |
| Nifty 50 | 2% Dip | 45.5% | 54.5% | ₹1,27,489 | ₹1,27,241 | -₹64 |
| Nifty 50 | 3% Dip | 38.6% | 61.4% | ₹1,27,489 | ₹1,27,130 | -₹294 |
| Nifty 50 | 5% Dip | 48.5% | 51.5% | ₹1,27,489 | ₹1,27,029 | -₹148 |
| Nifty Midcap 150 | 2% Dip | 58.4% | 41.6% | ₹1,30,876 | ₹1,29,779 | +₹306 |
| Nifty Midcap 150 | 3% Dip | 58.4% | 41.6% | ₹1,30,876 | ₹1,29,286 | +₹489 |
| Gold | 2% Dip | 74.2% | 25.8% | ₹1,28,848 | ₹1,28,009 | +₹389 |
| Gold | 3% Dip | 54.9% | 45.1% | ₹1,28,848 | ₹1,27,609 | +₹322 |
1. Large Caps: Higher Win Rate, Meaningless Payoff
For the Nifty 50, buying small dips (1% to 3%) wins 54.5% to 62.7% of the time. But look closely at the actual monetary gain: on an investment of ₹1,20,000, the median outperformance of waiting for a 2% dip is just ₹64. For a 3% dip, it is ₹294.
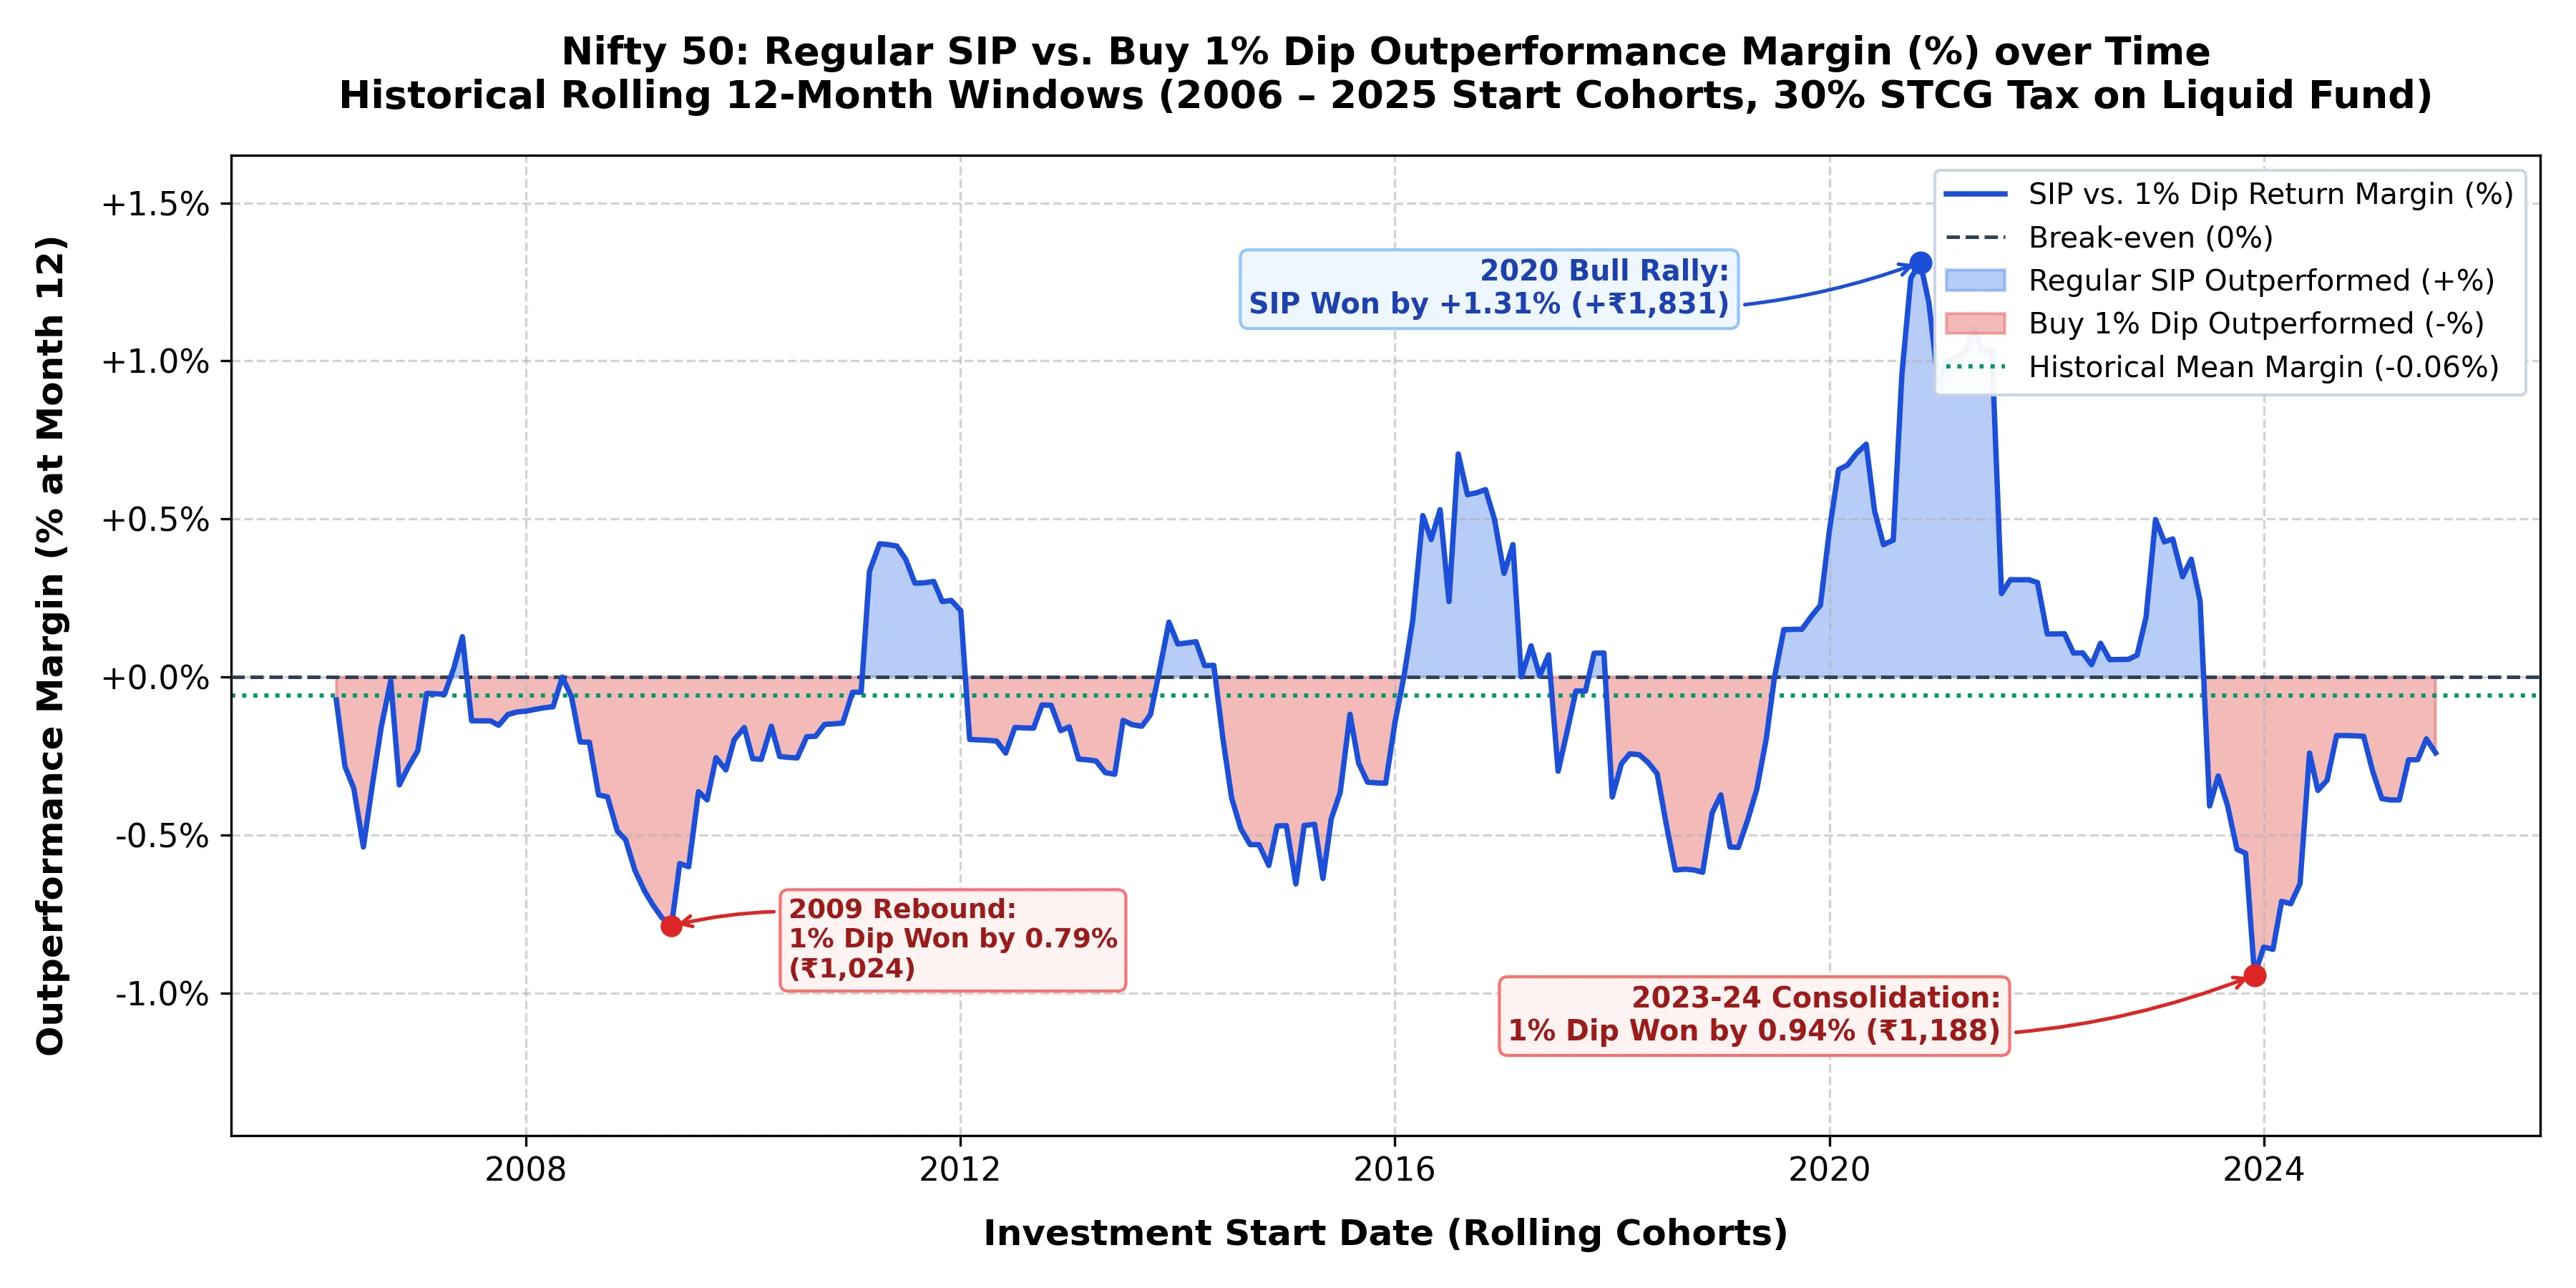
That amounts to a return difference of less than 0.25%. Over 20 years of data, the rolling performance line between SIP and Dip Buying oscillates within a very narrow band between -₹500 and +₹800.
2. Midcaps and Gold: The Heavy Cost of Waiting
In momentum and high-growth assets like Midcaps and Gold, the story reverses. Regular SIP beats dip-buying in 54% to 74% of all historical cohorts.
Because Midcaps and Gold frequently embark on sustained upward trends, waiting for pullbacks causes cash to sit idle in liquid funds while prices pull away. By the time a 2% or 3% dip finally occurs, the discounted entry price is often higher than the price you would have paid months earlier via regular SIP.
Key Note: The Cash Drag Cost
Cash on the sidelines carries a steep opportunity cost. The small benefit of catching a temporary dip rarely compensates for the broader market growth missed while waiting in cash.
Market Regimes: When Does Dip-Buying Help?
Analyzing Nifty 50 outcomes across different market environments (using a 2% dip trigger) illustrates the trade-off:
- Bull Markets (Market up >5% over 12M): Regular SIP wins 54.9% of the time. In rising markets, dips are shallow and fleeting; uninvested cash misses compounding.
- Sideways Markets (-5% to +5% return): Buy the Dip wins 72.1% of the time. When the index oscillates in a range, capturing lower boundaries creates a small advantage.
- Bear Markets (Market down <-5% over 12M): Buy the Dip wins 82.1% of the time. In persistent downtrends, staggering purchases lower your average acquisition cost effectively.
Because no investor can reliably predict whether the upcoming year will be a bull or bear phase, relying on dip-buying often leaves investors on the sidelines during sudden rallies.
The Behavioral Cost: Effort vs. Reward
Successful investing is as much about managing human psychology as managing numbers. When you choose to manually buy dips, you introduce three hidden behavioral taxes:
- Daily Cognitive Load: You must track markets constantly, calculate price drops, and manually execute orders.
- Execution Paralysis: When the index actually drops 3% or 5%, market news is invariably grim. Investors hesitate, waiting for a deeper drop tomorrow, and miss the entry window altogether.
- Disproportionate Effort: Tracking markets for 250 trading days to gain an extra ₹200 on ₹1.2 Lakh invested represents a poor return on your mental energy.
The Investor Decision Framework
Based on two decades of historical data, here is the recommended roadmap:
- Automate Your Core Wealth Engine: Maintain an automated monthly SIP for your primary financial goals. It eliminates emotional hesitation, prevents cash drag, and beats or matches tactical timing across most market phases.
- Deploy Dips Only with Windfalls: If you receive unexpected surplus capital (such as an annual bonus or tax refund), by all means deploy it opportunistically during market pullbacks. But never pause your regular SIP to hoard cash for market corrections.
Systematic investing is not a compromise. It is an empirically proven strategy that protects your returns, your discipline, and your time.
This article is for financial education only, this does not constitute investment advice.
Investment in securities market are subject to market risks, read all the related documents carefully before investing.