Do Top Performing Mutual Funds Stay at the Top? What 15 Years of Data Reveals
August 26, 2026
When most retail investors look for a mutual fund, they open an investing app, filter by category, and tap the column labeled “5-Year Return (High to Low).” The assumption feels intuitive: fund managers who delivered stellar returns over the last five years must possess superior stock-picking skill, making them the safest bet for the next five years.
Every mutual fund document carries a standard warning: “Past performance may or may not be sustained in the future.” Yet, almost everyone ignores it, treating past returns as a reliable roadmap. But does this rear-view mirror strategy actually work? If you buy the top-performing funds of today, will they remain winners five years from now?
To answer this objectively, we conducted an extensive empirical study on 15 years of daily Net Asset Value (NAV) data from May 2011 to May 2026 across Indian equity funds. We divided the 15-year timeline into three consecutive, non-overlapping 5-year cycles: Period 1 (2011 to 2016), Period 2 (2016 to 2021), and Period 3 (2021 to 2026). We tracked schemes across Large Cap, Mid Cap, Small Cap, and Flexi Cap categories to observe whether top-quartile funds managed to defend their crowns.
The verdict is unambiguous: top-performing mutual funds almost never stay at the top.
The Concept: How Do We Measure Persistence?
To measure whether fund performance persists, we group schemes into four equal performance quartiles within each category:
- Top Quartile (Q1): The top 25% of funds delivering the highest returns in a given 5-year block.
- Middle Quartiles (Q2 and Q3): Funds falling between the 25th and 75th percentiles.
- Bottom Quartile (Q4): The bottom 25% of funds lagging the category.
If fund manager skill is persistent, a fund in Q1 during Period 1 should have a high probability of staying in Q1 during Period 2. If markets were completely random, a Q1 fund would have a 25% chance of landing in any quartile simply by luck.
We evaluated schemes using two distinct return standards:
- 5-Year Point-to-Point CAGR: The standard trailing return seen on popular apps.
- Mean 3-Year Rolling CAGR: The average of daily 3-year rolling returns across the entire 5-year block, which neutralizes single-day start and end date biases to measure true consistency.
The Hard Numbers: Performance Does Not Persist
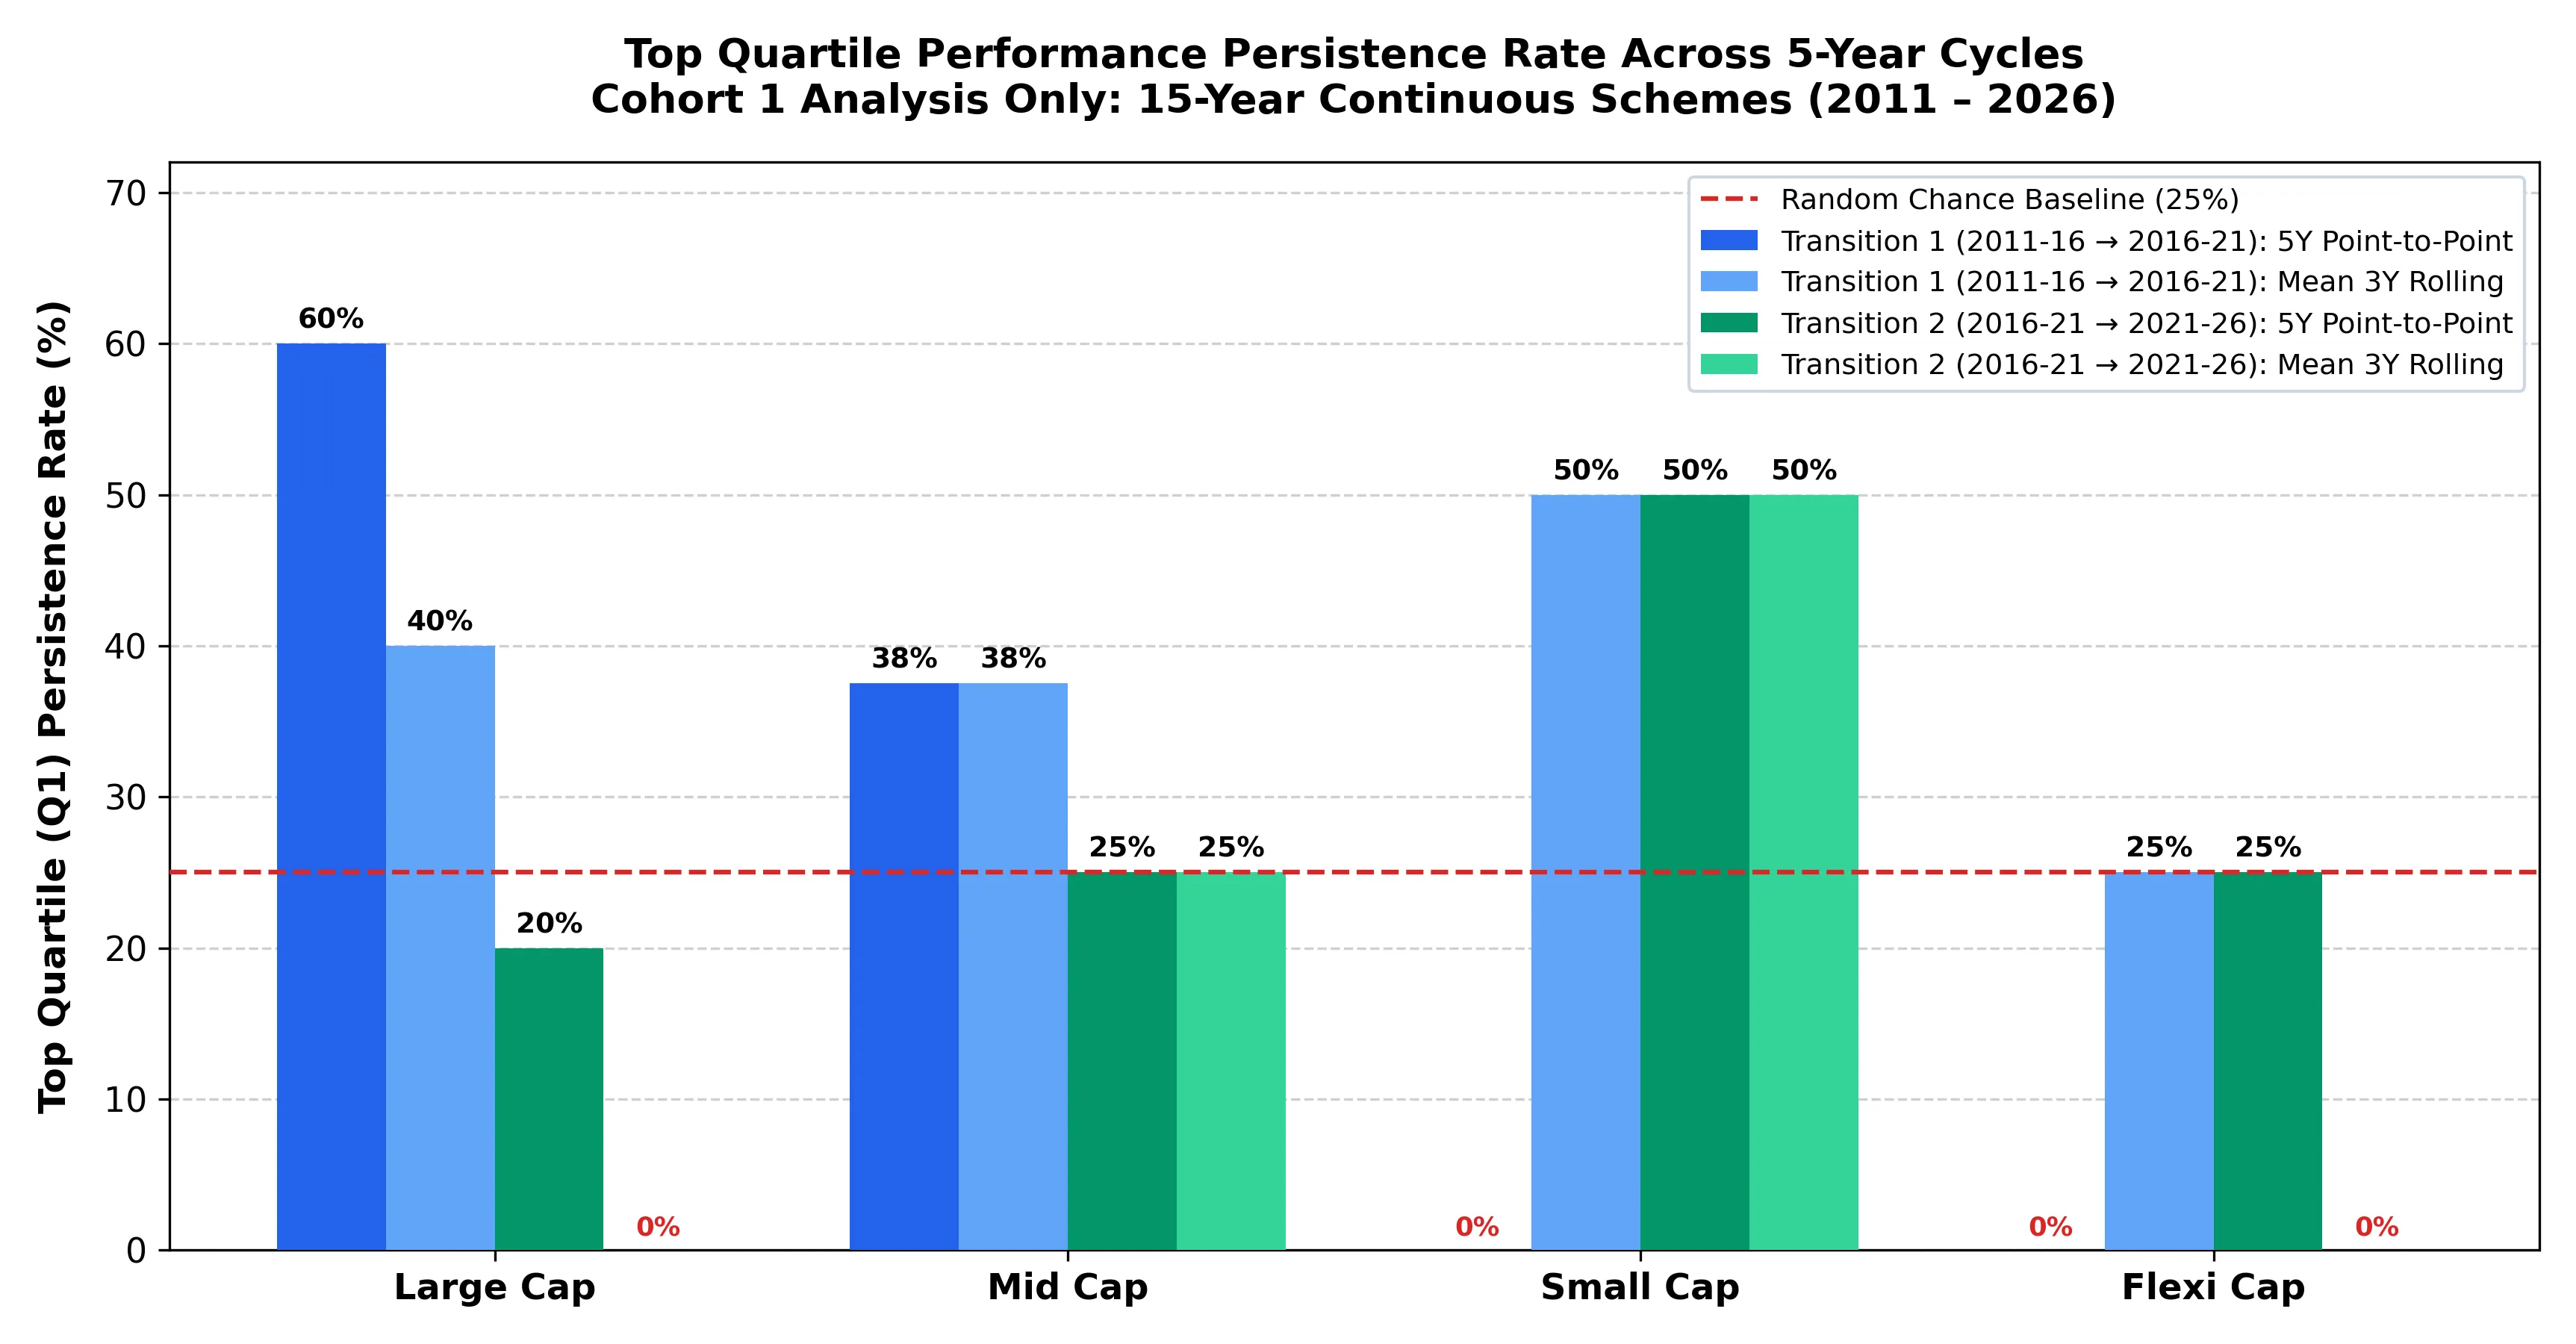
Across all four equity categories, the data demonstrates that past winners struggle to repeat their success. In fact, a top-quartile fund is just as likely (and often more likely) to plummet into the bottom half of its category as it is to remain in the top quartile.
The rank correlation (Spearman rho) between consecutive 5-year periods averaged between -0.20 and +0.20 across categories. Statistically, this is indistinguishable from a random shuffle.
1. 5-Year Point-to-Point CAGR (Standard Trailing Returns)
| Category | Schemes Tracked | Q1 Repeat Rate (2011-16 to 2016-21) | Q1 Repeat Rate (2016-21 to 2021-26) | Statistical Baseline (Random Chance) |
|---|---|---|---|---|
| Large Cap | 20 | 60.0% | 20.0% | 25.0% |
| Mid Cap | 31 | 37.5% | 25.0% | 25.0% |
| Small Cap | 8 | 0.0% | 50.0% | 25.0% |
| Flexi Cap | 15 | 0.0% | 25.0% | 25.0% |
2. Mean 3-Year Rolling CAGR (Sustained Consistency)
| Category | Schemes Tracked | Q1 Repeat Rate (2011-16 to 2016-21) | Q1 Repeat Rate (2016-21 to 2021-26) | Statistical Baseline (Random Chance) |
|---|---|---|---|---|
| Large Cap | 20 | 40.0% | 0.0% | 25.0% |
| Mid Cap | 31 | 37.5% | 25.0% | 25.0% |
| Small Cap | 8 | 50.0% | 50.0% | 25.0% |
| Flexi Cap | 15 | 25.0% | 0.0% | 25.0% |
When evaluating true underlying consistency via rolling returns, the myth of persistence falls apart completely:
- In Large Caps, between 2016-2021 and 2021-2026, 0 out of 5 top-quartile funds managed to remain in the top quartile.
- In Flexi Caps, the rolling return persistence rate in both transition periods hovered between 0% and 25%, matching or trailing pure random chance.
Key Note: Survivorship Bias
The study only includes schemes with a continuous NAV history across all 15 years. Funds that were merged or shut down along the way, often after long stretches of underperformance (many disappeared in the mergers that followed SEBI’s 2017-18 scheme recategorisation), are not in the sample. That tilts the data toward funds that did well enough to survive, so the full fund universe would likely look worse for active funds, not better. It does not rescue the case for chasing winners: even among the survivors, top-quartile ranks did not persist.
Case Study: What Happened to the Top 5 Large Cap Funds?
To see how this affects actual investor portfolios, consider the top 5 Large Cap funds from Period 1 (2011 to 2016) and watch their trajectory over the next decade:
| Fund Name | 2011-16 Rank (P1) | 2016-21 Rank (P2) | 2021-26 Rank (P3) | Long-Term Trajectory |
|---|---|---|---|---|
| SBI Large Cap Fund | #1 (15.2%) | #13 (13.3%) | #11 (13.1%) | Fell from #1 straight into the bottom half of the category (#13 and #11) in subsequent cycles. |
| Mirae Asset Large Cap Fund | #2 (14.6%) | #3 (16.5%) | #16 (12.0%) | Sustained top-tier performance through P2, but collapsed into the bottom quartile (Q4, #16) in P3 as AUM expanded. |
| ABSL Large Cap Fund | #3 (12.9%) | #16 (13.1%) | #10 (13.3%) | Suffered a sharp drop in P2 to the bottom quartile (#16), then hovered in the middle (#10). |
| Axis Large Cap Fund | #4 (12.1%) | #2 (17.1%) | #20 (9.3%) | Classic boom-and-bust cycle: peaked at #2 during a growth rally, then plunged to #20 (bottom of category). |
| Edelweiss Large Cap Fund | #5 (12.0%) | #4 (14.7%) | #6 (13.9%) | The sole fund from the 2011-16 top 5 that held steady, staying between #4 and #6 across all cycles. |
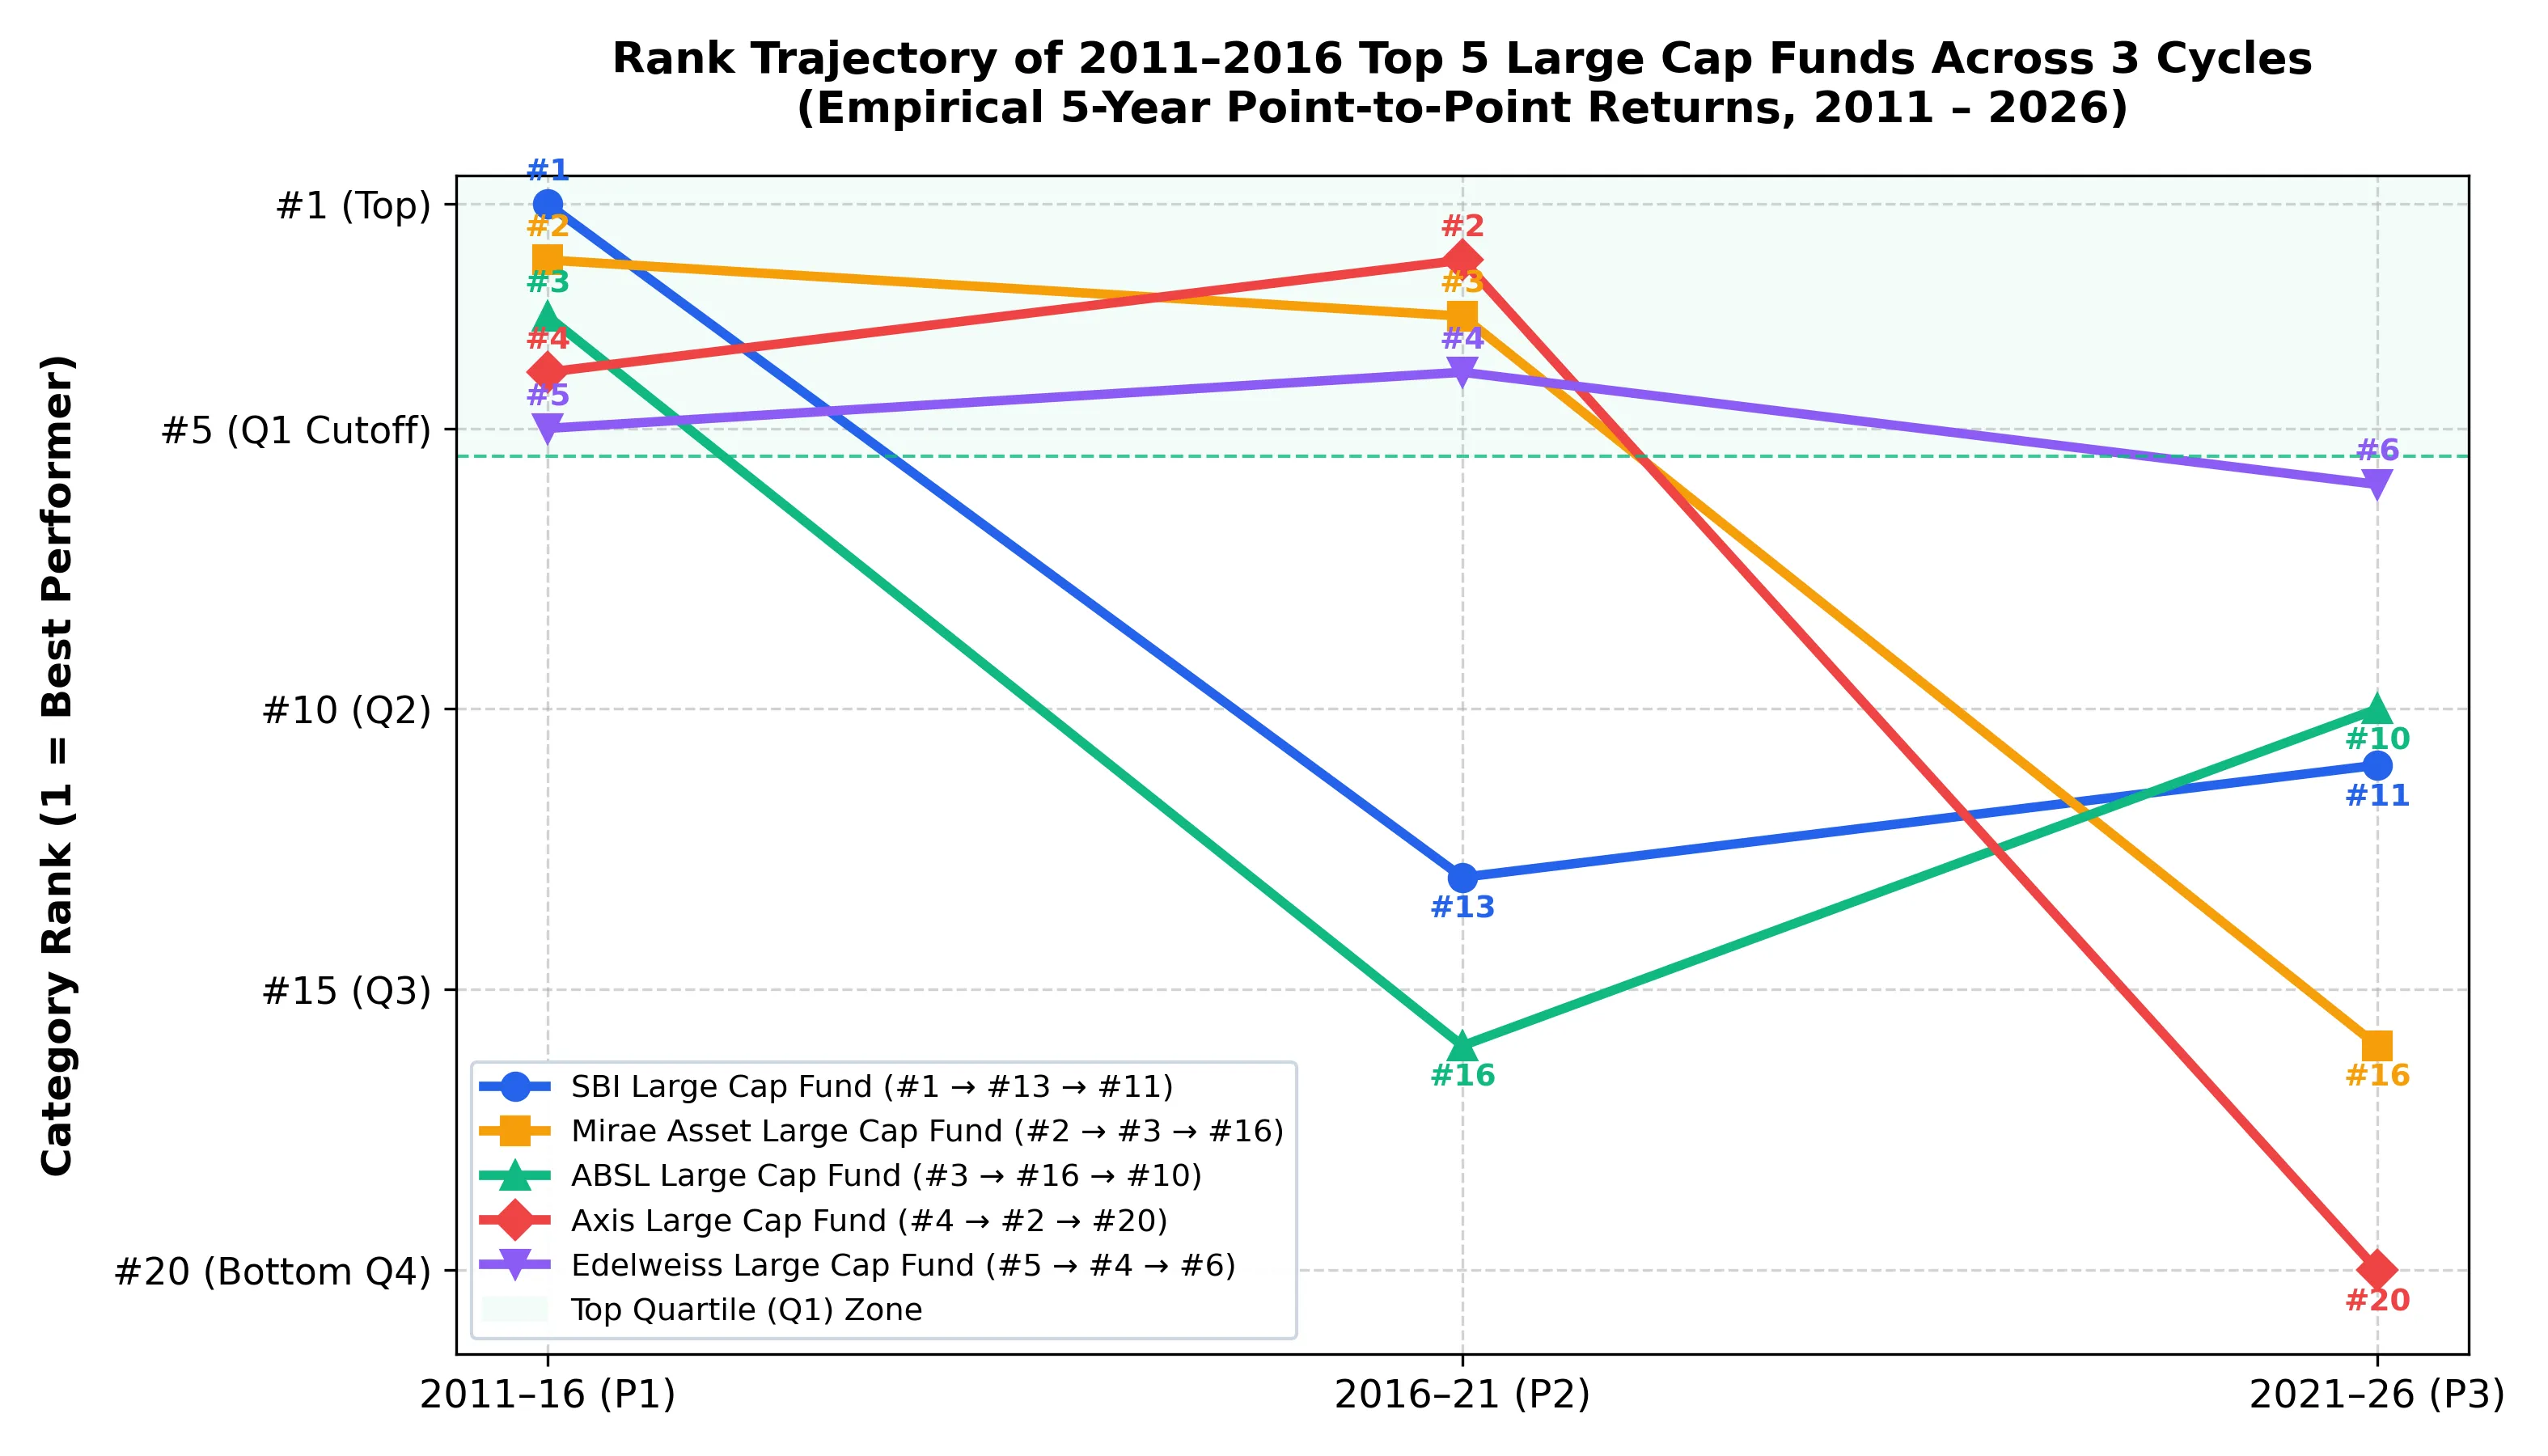
Out of the five best-performing large-cap funds of 2011 to 2016, four experienced steep falls into the bottom half or bottom quartile (Q3 or Q4) in subsequent cycles. Mirae Asset and Axis vividly demonstrate how quickly fortunes reverse: stellar runs frequently end in bottom-quartile performance as fund size swells or market styles rotate.
Key Note: The Takeaway on Rankings
Fund leaderboards are fluid. Yesterday’s chart-toppers regularly become tomorrow’s laggards as market environments shift.
Why Winners Rotate: The Forces of Mean Reversion
Why does past outperformance fail to persist? Three structural forces drive rank rotation in active mutual funds:
- Market Style Cycles: Stock markets move in distinct regimes: value versus growth, quality versus momentum, cyclical versus defensive. A fund manager whose philosophy favors capital-goods cyclicals will look brilliant during a manufacturing boom. When the cycle rotates to consumer defensive or tech, that exact same philosophy will lag the index.
- The Curse of Success (AUM Bloat): When a fund tops 5-year return charts, retail money floods in. Managing ₹30,000 Crore is fundamentally different from managing ₹3,000 Crore. As a fund grows massive, the manager can no longer take meaningful positions in agile midcap ideas without moving market prices. The fund gradually turns into a high-cost index proxy.
- Statistical Mean Reversion: Exceptional 5-year returns are almost always a combination of skill, style alignment, and luck. Because luck does not repeat consistently, extraordinary performance naturally reverts toward category averages over time.
How Investors Should Actually Evaluate Mutual Funds
If sorting by past 5-year returns is a flawed strategy, how should you select funds?
- Stop Chasing Trailing Returns: Never pick a scheme purely because it sits at the top of a 1-year, 3-year, or 5-year leaderboard.
- Examine Downside Protection: Look at how the scheme performed during broad market downturns (such as 2015-16, 2020, or 2022). Funds that lose significantly less than the benchmark during bear markets generate sustainable long-term compounding.
- Evaluate Portfolio Discipline: Focus on portfolio turnover, manager tenure, and investment philosophy consistency rather than short-term performance spikes.
- Consider Low-Cost Index Funds: If active managers struggle to maintain top performance across cycles, you do not have to play the guessing game. Low-cost index funds (tracking the Nifty 50 or Nifty 500) remove fund manager risk, style drift, and AUM bloat entirely. By capturing broad market returns at a minimal expense ratio (often under 0.10% to 0.20%), you ensure you never get stuck holding a bottom-quartile active fund.
- Control Costs via Direct Plans: Because you cannot control market cycles or fund manager luck, control the one variable that is 100% guaranteed: fund expenses. Choosing Direct Plans over Regular Plans saves 0.50% to 1.50% annually, adding compounding certainty to your wealth.
This article is for financial education only, this does not constitute investment advice.
Investment in securities market are subject to market risks, read all the related documents carefully before investing.