Lumpsum vs. STP: What 20 Years of Market Data Tells Us About Deploying Cash
August 22, 2026
You have just received an annual performance bonus, closed a property sale, or watched a fixed deposit mature. A sizable sum sits in your bank account, ready for equity allocation. Almost immediately, hesitation sets in. Should you invest the full amount right away, or park it in a liquid fund and systematically transfer it into equity over the next 12 months?
Conventional wisdom usually recommends a Systematic Transfer Plan (STP). The rationale seems foolproof: staggering your entry protects you from investing at a market peak by averaging your costs. But does long-term market data support this belief, or are you paying an invisible penalty for peace of mind?
To answer this objectively, we analyzed 20+ years of historical Indian market data (2005 to 2026) across 233 rolling 12-month cohorts. We evaluated an initial capital of ₹1,20,000 deployed via two strategies: a Day 1 Lumpsum versus a 12-month STP transferring ₹10,000 monthly from a liquid fund into the target asset. The numbers highlight a sharp contrast between mathematical probability and investor emotion.
The Concept: Market Exposure vs. Cash Drag
When choosing between Lumpsum and STP, you are fundamentally trading immediate market exposure against cash drag:
- Lumpsum: You deploy 100% of your capital on Day 1. Your money experiences full market volatility but benefits immediately from equity compounding.
- STP: You park capital in a liquid fund, moving a fixed tranche into equity each month. The unallocated balance earns liquid fund interest, but only a fraction of your capital participates in market movements during that first year.
At Month 12, both routes reach 100% equity allocation. Because no further transactions occur afterward, the number of units accumulated by Month 12 sets your portfolio value for the rest of your holding period.
The Historical Reality: Lumpsum Wins 2 Out of 3 Times
Over multi-year horizons, Indian equity markets spend far more time rising than falling. Holding back cash in a liquid fund delays participation in this upward trend.
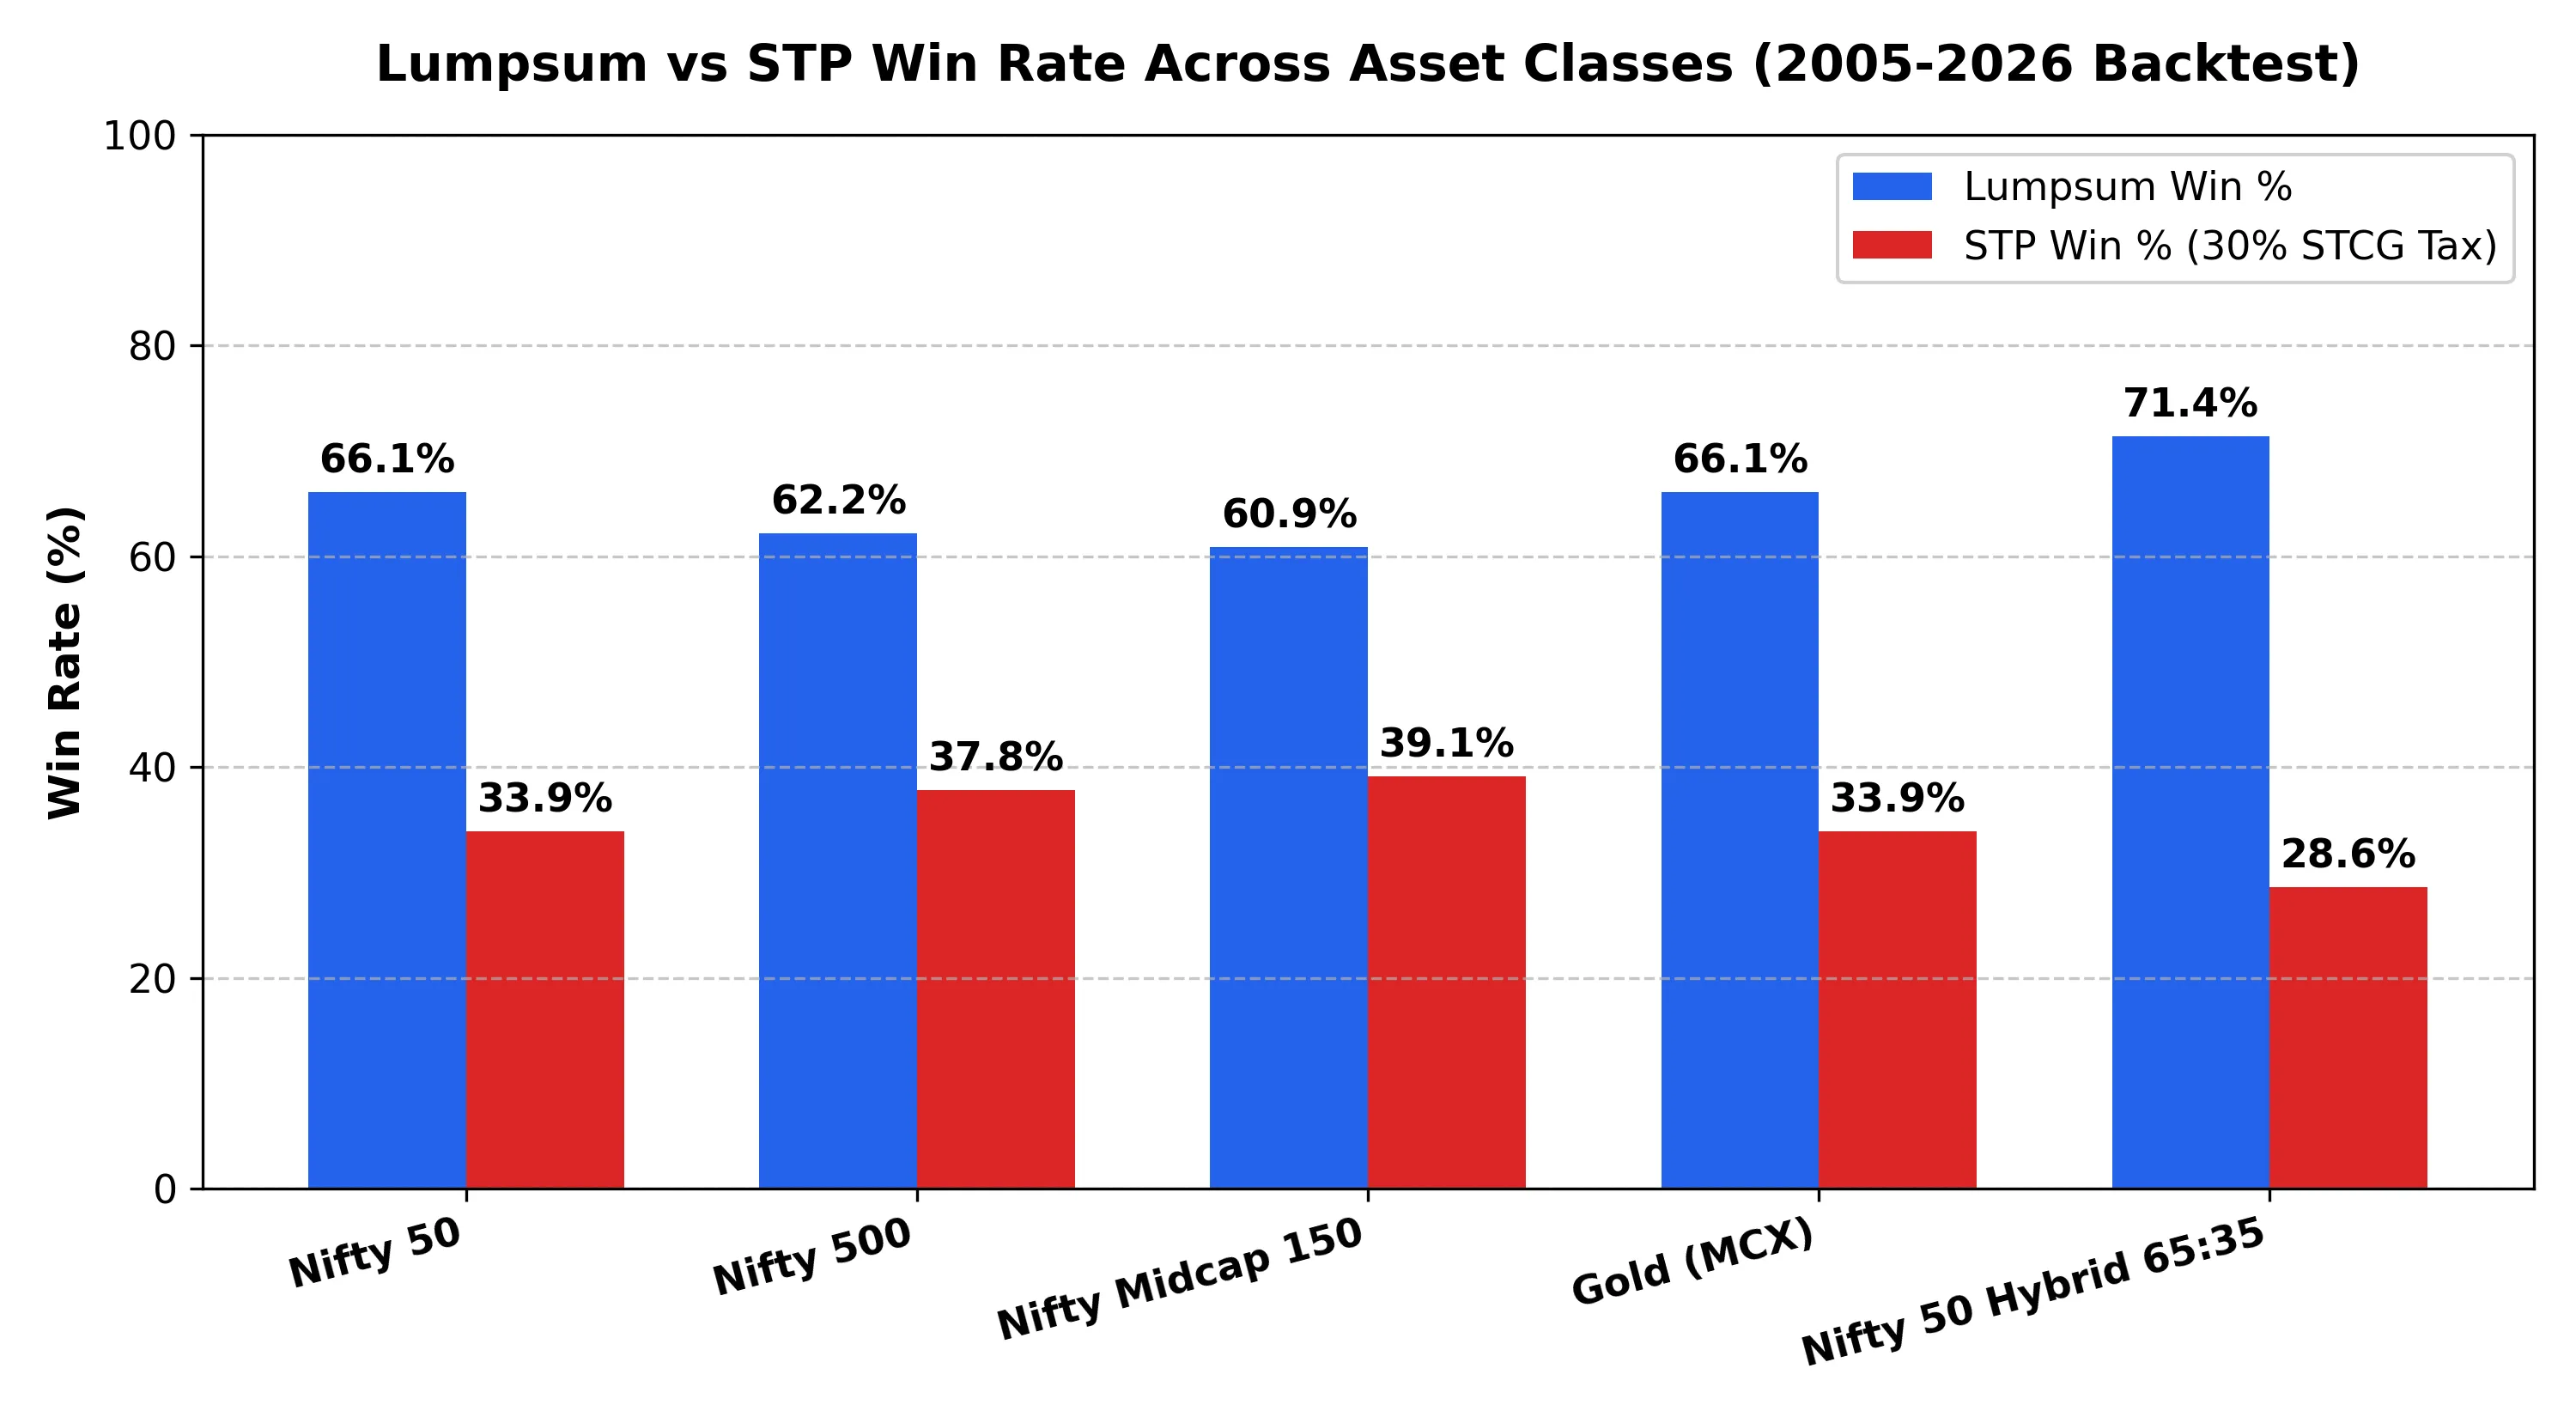
Across 233 rolling 12-month cohorts, Lumpsum outperformed STP in 61% to 71% of all historical periods across every major asset class.
| Asset Class | Total Cohorts | Lumpsum Win Rate | STP Win Rate | Avg. Lumpsum Value (₹) | Avg. STP Value (₹) | Avg. Lumpsum Edge (%) |
|---|---|---|---|---|---|---|
| Nifty 50 Index | 233 | 66.1% | 33.9% | ₹1,36,859 | ₹1,30,759 | +4.13% |
| Nifty 500 Index | 233 | 62.2% | 37.8% | ₹1,38,310 | ₹1,31,414 | +4.52% |
| Nifty Midcap 150 Index | 233 | 60.9% | 39.1% | ₹1,44,560 | ₹1,34,123 | +6.44% |
| Gold | 233 | 66.1% | 33.9% | ₹1,39,472 | ₹1,32,108 | +5.12% |
| Nifty 50 Hybrid 65:35 | 42 | 71.4% | 28.6% | ₹1,33,927 | ₹1,29,427 | +3.40% |
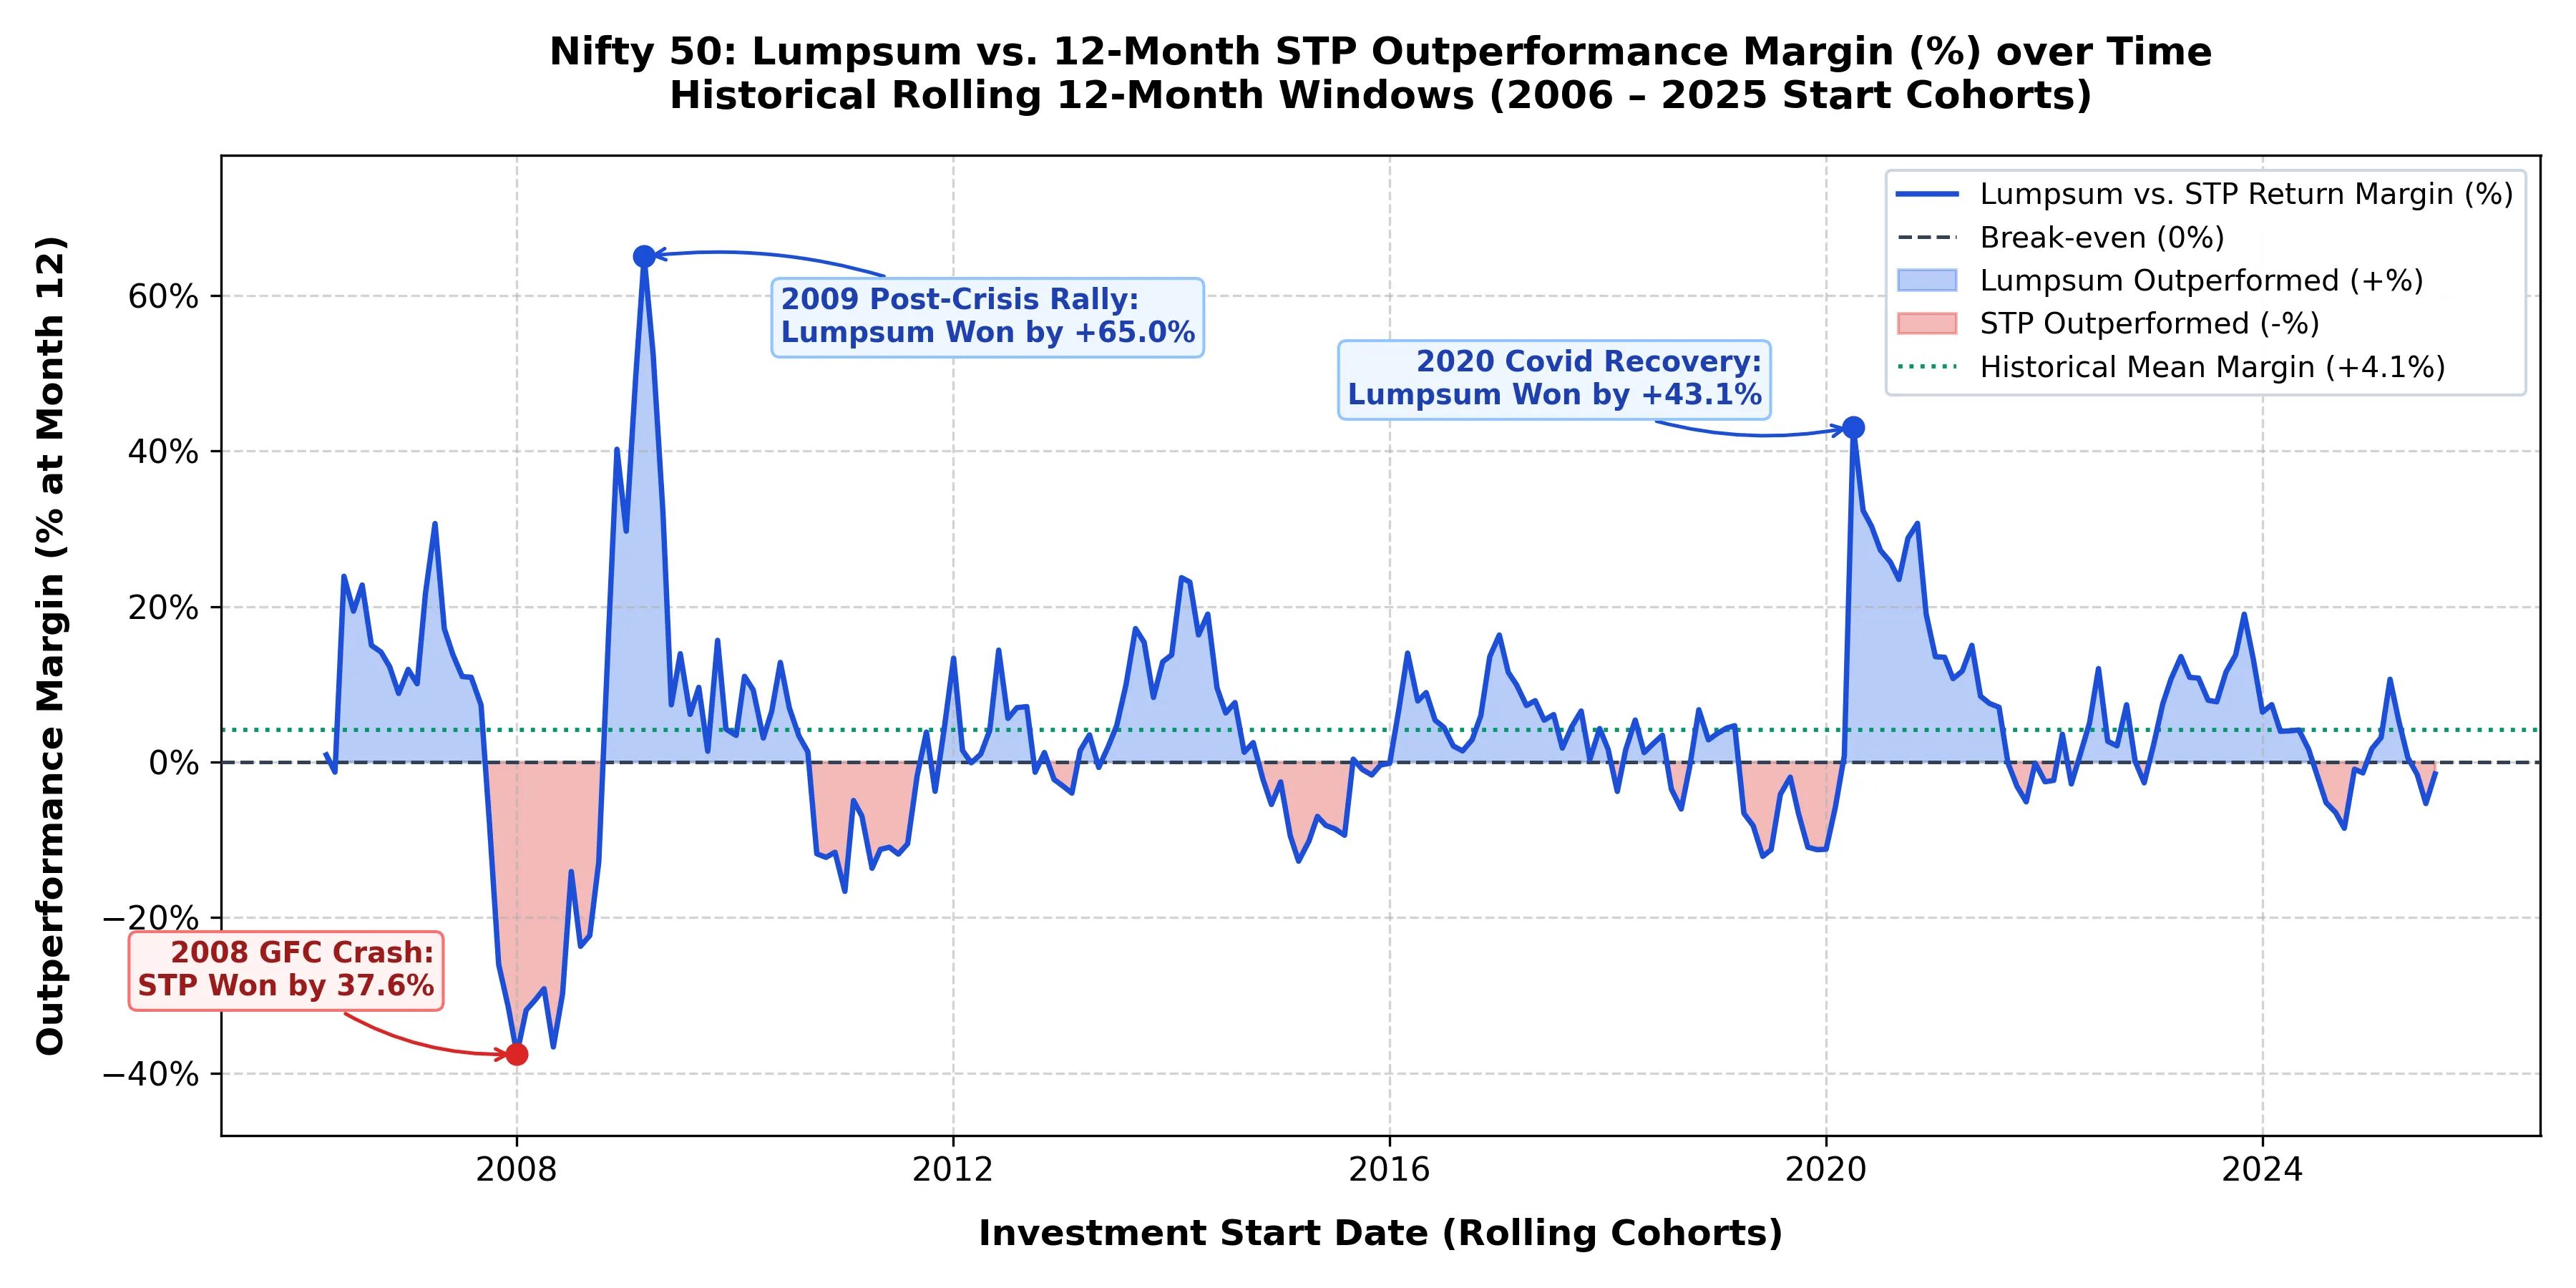
On the benchmark Nifty 50 Index, Lumpsum won in roughly two out of every three starting months (66.1%). On average, Lumpsum produced a terminal value of ₹1,36,859 compared to ₹1,30,759 for STP (a +4.13% average edge, or a median gain of +₹4,779 per ₹1.2 Lakh invested). In Midcaps, the average Lumpsum outperformance expanded to +6.44% (+₹10,437).
Key Note: The Equity Risk Premium
Equity indices generate higher expected returns than liquid funds. Delaying investment leaves cash idle at modest debt rates while missing equity upside in roughly two-thirds of historical cycles.
When Does STP Actually Deliver?
STP is not broken; it simply requires a specific market environment to add value. Segmenting the 233 cohorts by actual realized 12-month returns reveals how each strategy behaves:
- Bull Markets (Market up >5% over 12M): Lumpsum wins 86.4% of the time on Nifty 50. Staggering your entries forces you to buy progressively costlier units each month.
- Bear Markets (Market down <-5% over 12M): STP wins 92.9% of the time on Nifty 50. Rupee cost averaging shines here, lowering your average acquisition cost as prices decline.
- Sideways Markets (-5% to +5% return): STP wins 72.1% of the time. Because equity prices stay flat, the liquid fund interest earned on the idle balance creates a small winning margin.
Predicting which regime lies ahead is virtually impossible. Even attempting to time entry using technical indicators (like whether the market is below its 200-day moving average on Day 1) fails to help. In India, sharp dips below trendlines are often followed by swift V-shaped recoveries that leave staggered investors behind.
The Hidden Penalty: 30% STCG Tax Drag
Many investors calculate STP returns assuming zero friction. In reality, Indian tax laws impose a direct cost on liquid fund redemptions.
Gains from debt and liquid mutual funds are taxed at your marginal income tax slab rate (assumed at 30%). Each monthly transfer redeems units and triggers a taxable event:
- In our analysis, the average 30% STCG tax paid across 12 monthly transfers was ₹1,287 per ₹1.2 Lakh invested.
- This tax friction reduced the net money moving into equity, boosting Lumpsum’s win rate advantage by an additional +1.7% to +6.4%. On Nifty 50, factoring in tax raised Lumpsum’s win rate from 62.7% (pre-tax) to 66.1%.
Behavioral Reality: Returns vs. Regret
If Lumpsum is mathematically superior 66% of the time, why is STP so widely recommended?
Because investing is not just about maximizing math; it is about managing regret. Loss aversion causes humans to feel the sting of a financial loss twice as intensely as the pleasure of an equivalent gain. If you invest a lump sum and the market drops 12% next month, the emotional agony can tempt you to exit near the bottom. If the market surges after starting an STP, you might feel minor irritation, but never acute panic.
STP functions as an emotional shock absorber. It trades roughly 4% of expected return for behavioral discipline.
The Decision Framework
Use these guidelines to choose your deployment approach:
- Portfolio Proportion: If the cash represents an addition to an existing portfolio (under 15% to 20% of net worth), deploy as a Lumpsum. The odds favor you, and any short-term drawdowns will not threaten your overall wealth.
- Time Horizon: If your goal is more than 7 to 10 years away, entry volatility gets absorbed over time. Choose Lumpsum.
- Anxiety Level: If this capital represents a rare windfall (inheritance, property sale) where an immediate 10% to 15% dip would cause sleepless nights, execute an STP over 6 to 12 months. Treat the modest return drag as an insurance premium for emotional peace.
This article is for financial education only, this does not constitute investment advice.
Investment in securities market are subject to market risks, read all the related documents carefully before investing.